Insights
Heatmaps Are Dead: Meet Predictive UX Modeling

Let’s be honest: heatmaps had a good run.
For over a decade, they served as the default visualization layer for understanding user behavior. Marketers loved them for their visual simplicity. Clients loved them because they “looked like data.” Tools like Hotjar, Crazy Egg, and FullStory gave us snapshots of attention—where users hovered, clicked, or scrolled.
But those days are ending. In 2025, heatmaps aren’t enough.
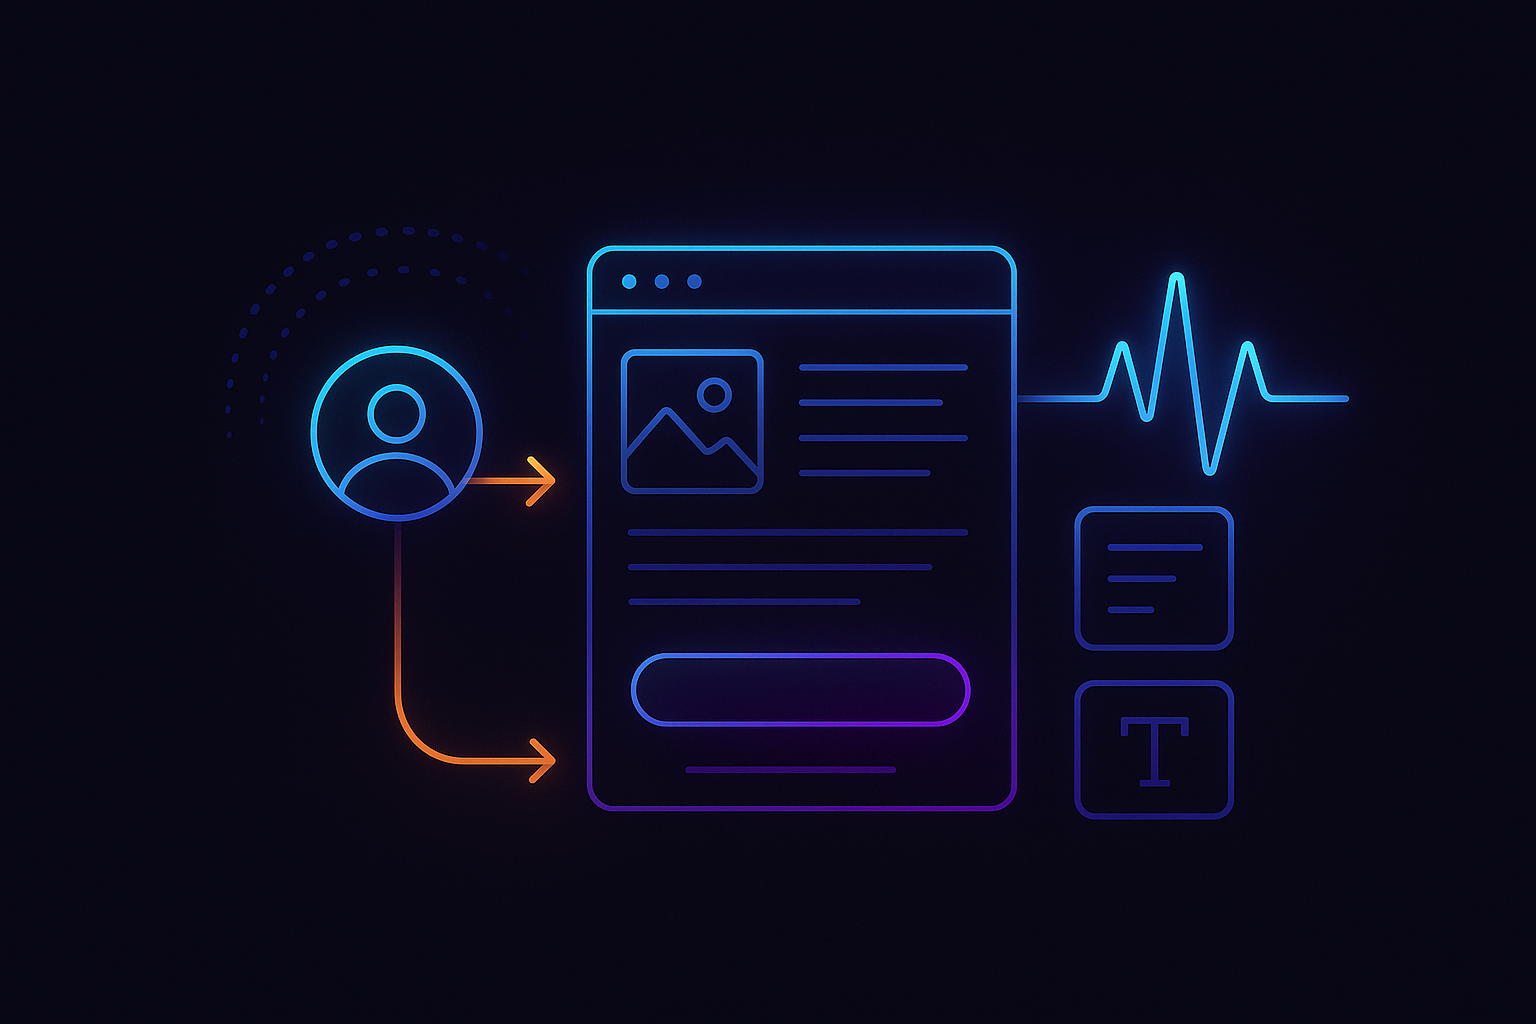
The web is faster, user behavior is more complex, and AI has redefined what’s possible in UX research. Forward-thinking teams are moving toward a new paradigm: predictive UX modeling.
Rather than waiting for post-launch data to trickle in, you can now simulate user behavior, forecast friction points, and pre-optimize your layouts—before a single visitor hits the site.
In this article, we’ll explore:
- Why heatmaps no longer cut it
- What predictive UX modeling really means
- How to use tools like ChatGPT, Hotjar, and GA4 to forecast and improve experience before launch
- Tactical frameworks, real-world examples, and tools to help you modernize your UX process
Why heatmaps are no longer enough
Traditional heatmaps are like looking in the rearview mirror. You can only see what’s already happened—usually in very specific contexts (e.g. logged-in desktop users from the U.S.).
Worse, they often present a false sense of clarity. As Jakob Nielsen put it in his critique of over-interpreting heatmaps: “A big red blob does not tell you why users are confused, only that they clicked a lot there” Nielsen Norman Group.
The 5 big limitations of heatmaps:
- They’re reactive. You can’t get data until your site is live—and often, too late to justify major changes.
- They ignore context. Heatmaps show clicks, not intent. You don’t know why someone clicked.
- They lack segmentation. You can’t easily isolate behavior by audience persona, source, or campaign.
- They don’t test hypotheticals. Want to know how a new layout might perform? Heatmaps are silent.
- They miss micro-interactions. Scroll depth is helpful—but what about hesitation time? Rage clicks? Mouse trajectories?
To keep up, you need proactive, not reactive tools. That’s where predictive modeling enters.
What is predictive UX modeling?
Predictive UX modeling is the process of forecasting user behavior on a web interface using AI, behavioral science, and pre-launch simulations. Instead of waiting for users to act, you model their likely behavior and optimize in advance.
This approach blends:
- Large language models (LLMs) like ChatGPT or Claude for cognitive modeling and UX copy prediction
- Event-based analytics like GA4 and Mixpanel to simulate real-world funnel flows
- AI-powered session replay tools (e.g. Smartlook, FullStory) that now offer anomaly prediction and rage-click forecasting
- Synthetic testing platforms (e.g. UserZoom, PlaybookUX, Maze) that use AI personas to simulate UX sessions
- Eye-tracking heatmap simulators (e.g. Attention Insight, EyeQuant) that predict visual salience in a layout before launch
Together, these tools create a predictive engine for decision-making.
How to build a predictive UX model (pre-launch)
Here’s a step-by-step guide you can apply today:
1. Define primary goals and success signals
Before modeling anything, define what success looks like for the page or flow.
- Is it a click on a CTA?
- A form completion?
- Reading a key value prop?
Then define intent signals to measure:
- First-interaction elements
- Hover duration
- Scroll velocity and drop-off
- CTA click vs. bounce-back
You’ll model around these variables.
2. Feed your wireframes to an AI for anticipatory friction analysis
Using tools like ChatGPT-4 or Claude, paste in your layout text (or screenshots via multimodal input) and prompt the AI to identify likely friction points.
Example prompt:
“You are a UX strategist. Given this mobile layout, identify which parts are likely to confuse or block user progression, and suggest 3 alternative interface changes to reduce friction.”
You can even layer on context:
- “Assume the user is mid-funnel.”
- “Assume the user is reading at 8th-grade level.”
- “Assume this page is seen after clicking a B2B retargeting ad.”
This isn’t magic—it’s strategic prompting.
3. Use synthetic eye-tracking to test visual hierarchy
Tools like Attention Insight or EyeQuant allow you to upload design files and instantly generate:
- Attention heatmaps
- Visual clarity scores
- Focus maps by element type
These are based on neural nets trained on thousands of real-world eye-tracking studies. According to Attention Insight, their accuracy is within 90% of actual eye-tracking lab tests—at a fraction of the time and cost.
Use these to test:
- Which CTA draws first focus
- Whether key content is seen above the fold
- If visual clutter is harming legibility
4. Forecast user paths using GA4 + funnel mapping
You can simulate likely behavior flows by combining:
- Google Analytics 4’s historical data (from similar pages or verticals)
- Mixpanel’s Journey Builder (if you’ve tracked similar flows)
- AI-assisted flow prediction using ChatGPT
For example, prompt ChatGPT like this:
“Here’s the user journey: Ad click → Landing Page → Product Detail → Pricing → Contact Form. Based on conversion data where 70% drop off at Pricing, propose 3 layout changes to retain attention and reduce bounce.”
This blends behavioral data with anticipatory AI reasoning.
5. Generate alternative copy and CTA variants with ChatGPT
Once you know where the friction is, use ChatGPT to generate UX variants.
Example prompt:
“Rewrite this form CTA for a mid-funnel B2B user in the financial industry. The user is skeptical, so the CTA must reduce perceived risk and emphasize value clarity.”
Or, for microcopy:
“What’s a more emotionally resonant alternative to ‘Submit’ for a lead gen form about retirement planning?”
Test these against predictive salience tools (see step 3) to choose winning versions.
Real-world example: Optimizing a SaaS pricing page before launch
We recently helped a SaaS startup improve their pricing page before it ever went live.
Old method:
- Waited 3 weeks post-launch to gather heatmap and form data
- Lost ~20% of paid traffic budget during that time to poor conversions
New predictive approach:
- Ran their wireframes through EyeQuant (attention heatmap)
- Modeled user friction with ChatGPT + FullStory benchmarks
- Identified confusion around “Free Trial” vs “Demo” CTAs
- Rewrote copy using AI prompt tuning
- Pre-tested 2 visual layouts with synthetic attention tracking
Result:
- Improved first-week conversion rate by 32%
- Reduced time to UX optimization from 3 weeks to 48 hours
The tools we recommend (and how to use them)
ChatGPT (GPT-4)
Copywriting, UX friction simulation, prompt-based modeling
Attention Insight
AI heatmaps and clarity scores
EyeQuant
Predictive attention and conversion modeling
Hotjar
Traditional heatmaps and recordings (for real-world validation)
GA4 + Mixpanel
Funnel mapping and path analysis
https://analytics.google.com, https://mixpanel.com
PlaybookUX / Maze
Synthetic user testing with AI personas
It’s time to move beyond heatmaps
AI is transforming UX the same way it transformed SEO and paid media. We’re no longer guessing. We’re forecasting.
Predictive UX modeling doesn’t replace real users—it complements them. It closes the time gap between design, launch, and insight. It helps you ship with more confidence, faster iteration cycles, and fewer costly surprises.







.jpeg)


.jpg)

.jpg)


.jpg)
